London Insights · Property

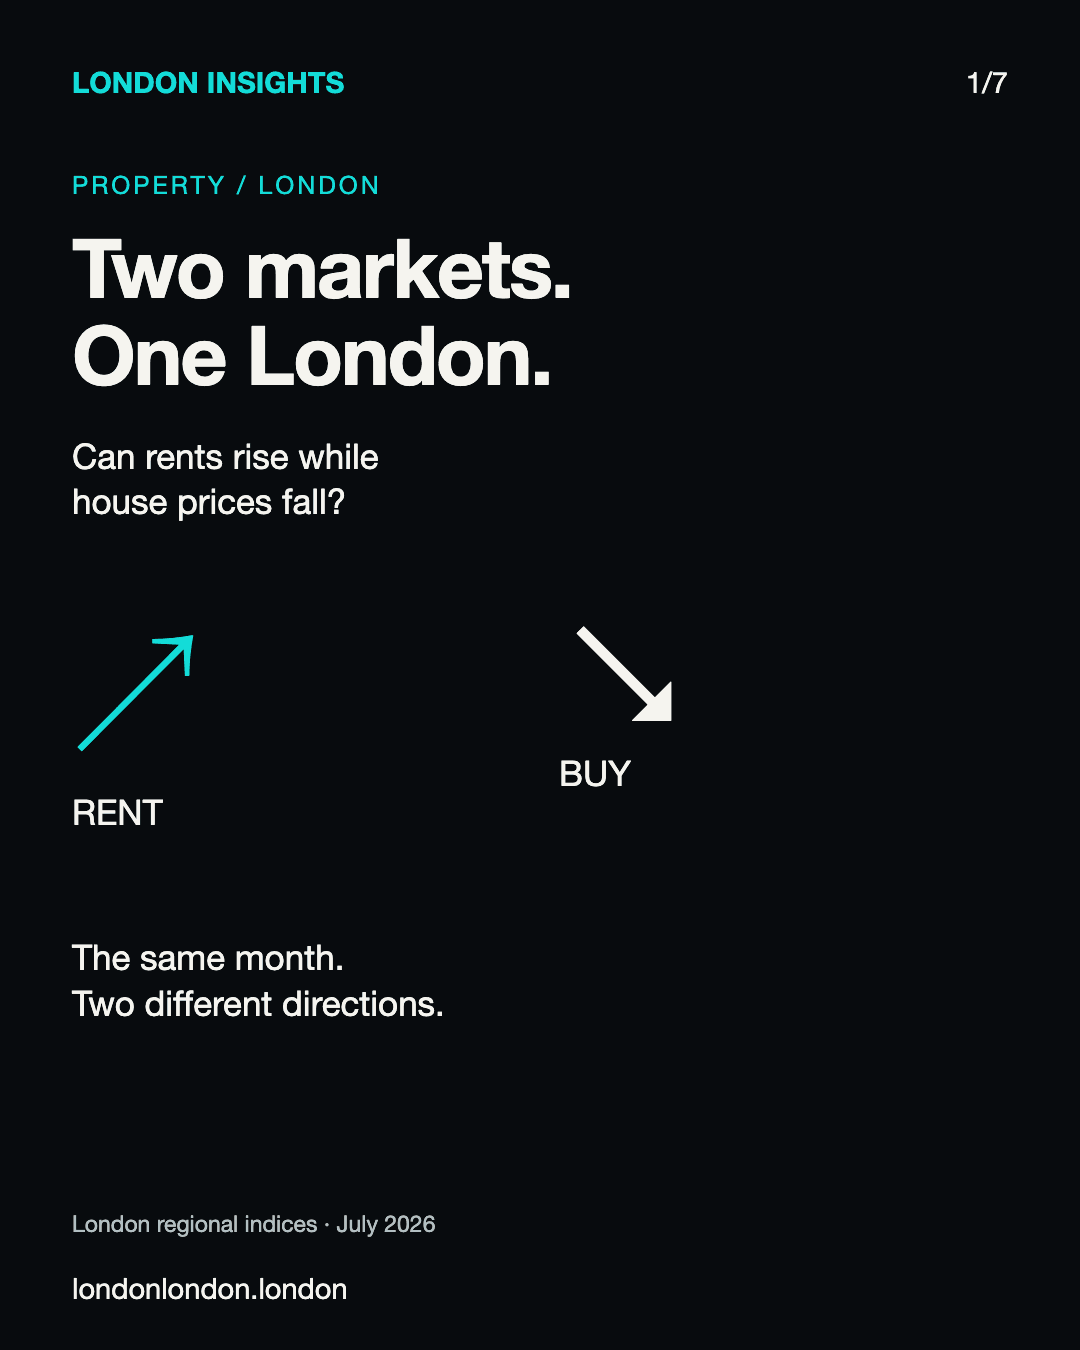
Two markets. One London.

Can rents rise while house prices fall? In July 2026, London’s two markets moved in different directions.

Published 20 October 2026 · Figures for July 2026

Two markets, one London. Rent arrow points up; buying arrow points down. A comparison of London annual changes in July 2026.
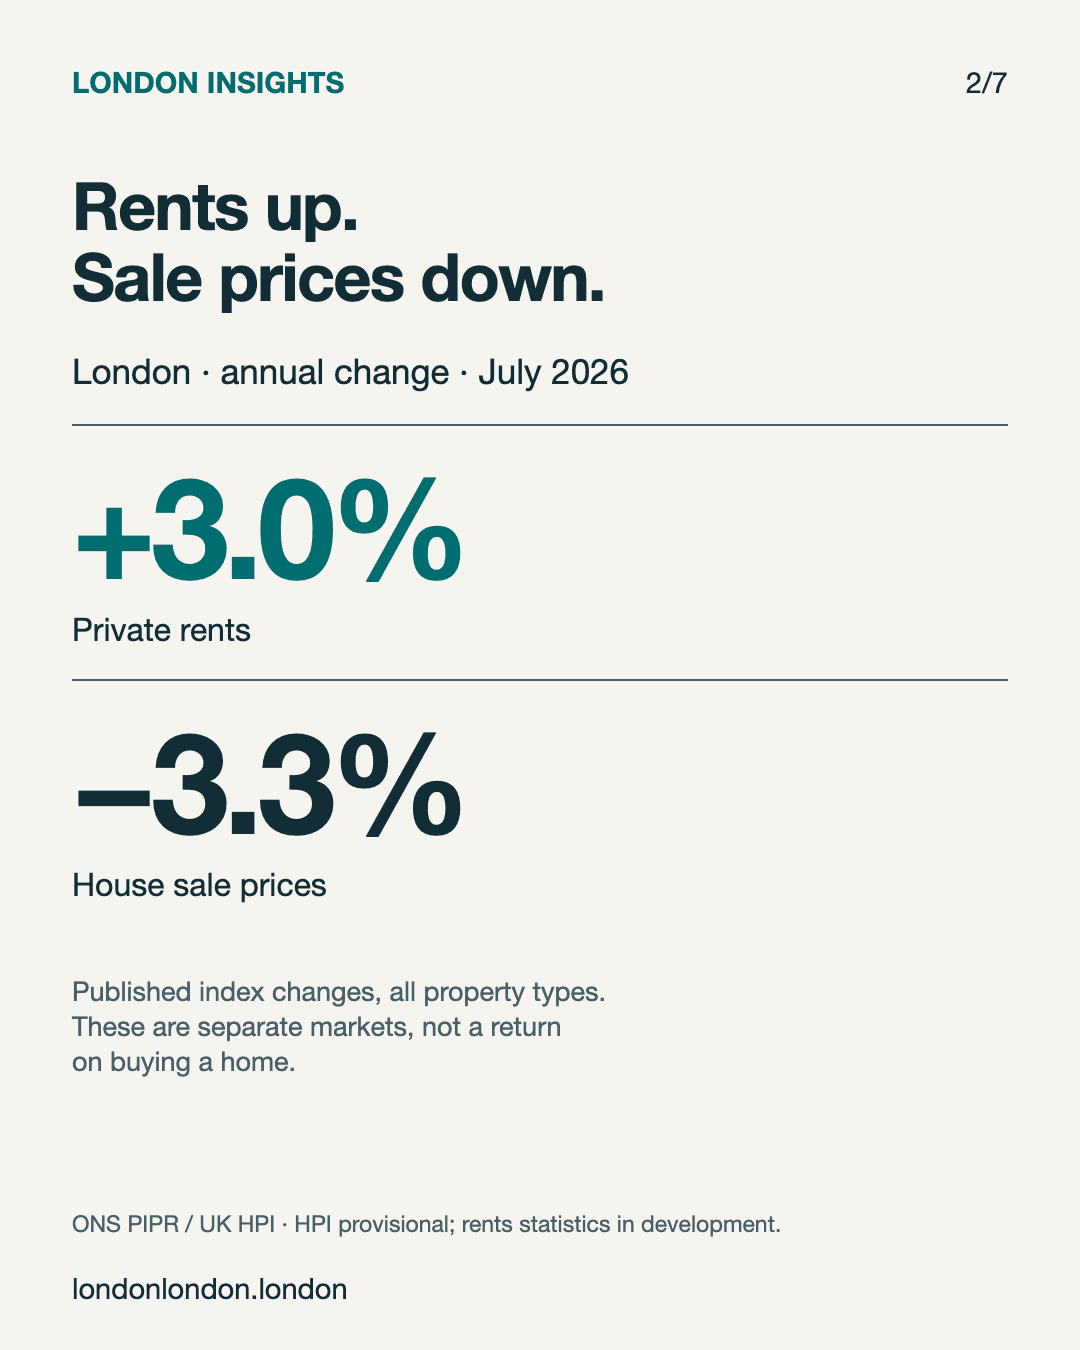
In July 2026 London private rents rose 3.0% over the year while house sale prices fell 3.3%. All property types; index-based annual changes.
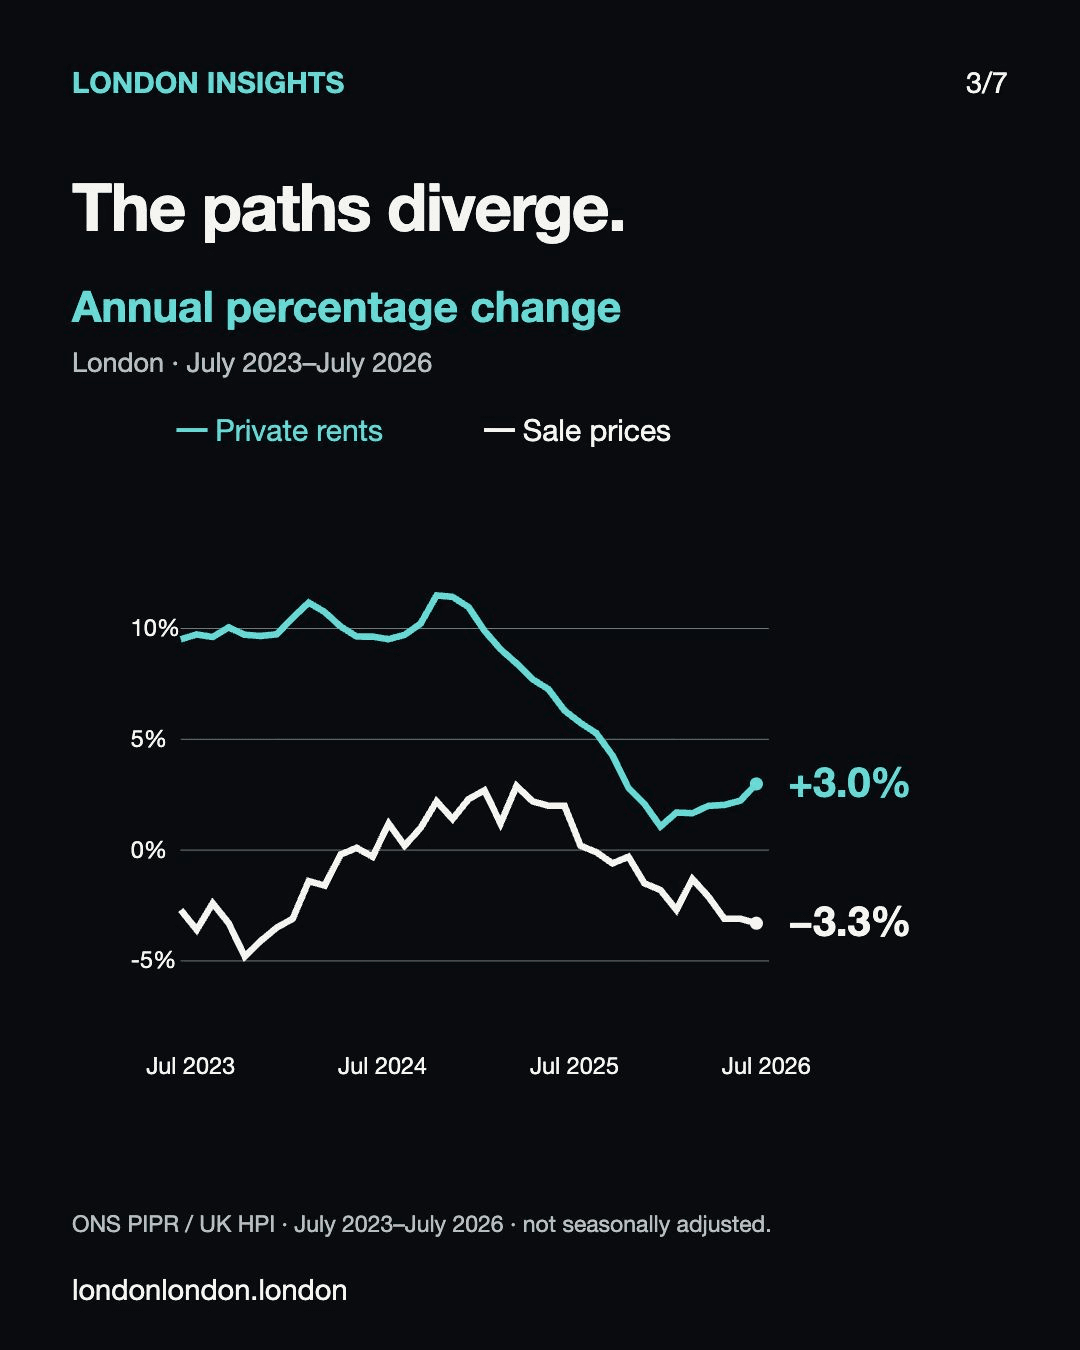
Annual percentage change in London private rents and house sale prices, July 2023–July 2026. The line ends are directly labelled +3.0% for private rents and −3.3% for house prices in July 2026. These are percentage changes, not price levels.
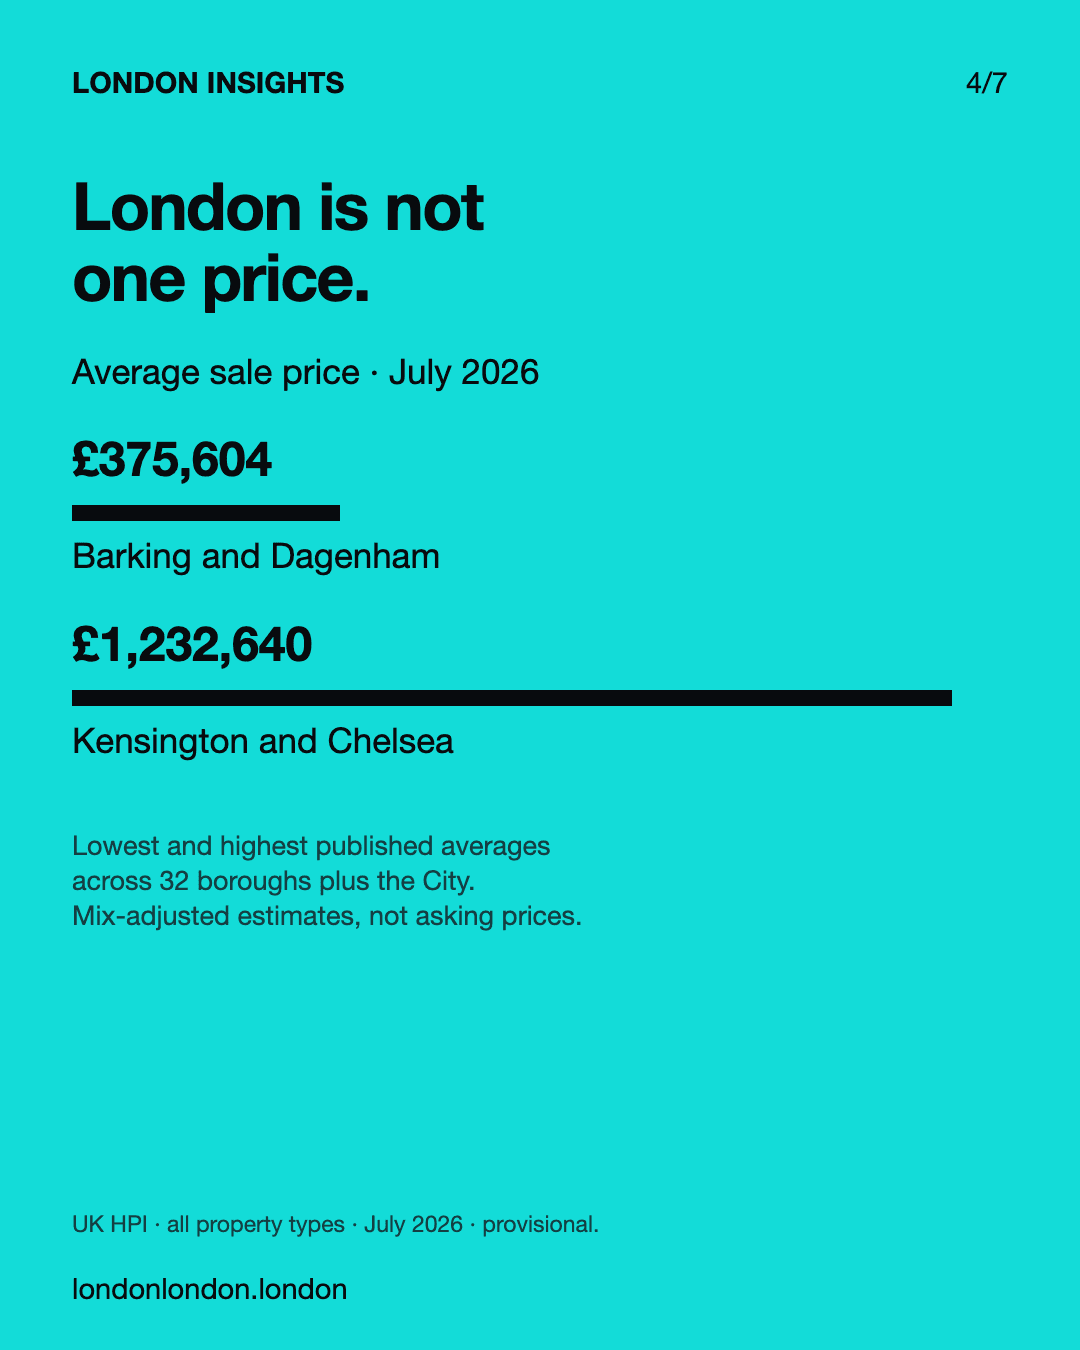
Average sale prices in July 2026 range from £375,604 in Barking and Dagenham to £1,232,640 in Kensington and Chelsea, the lowest and highest of 33 London authority areas.
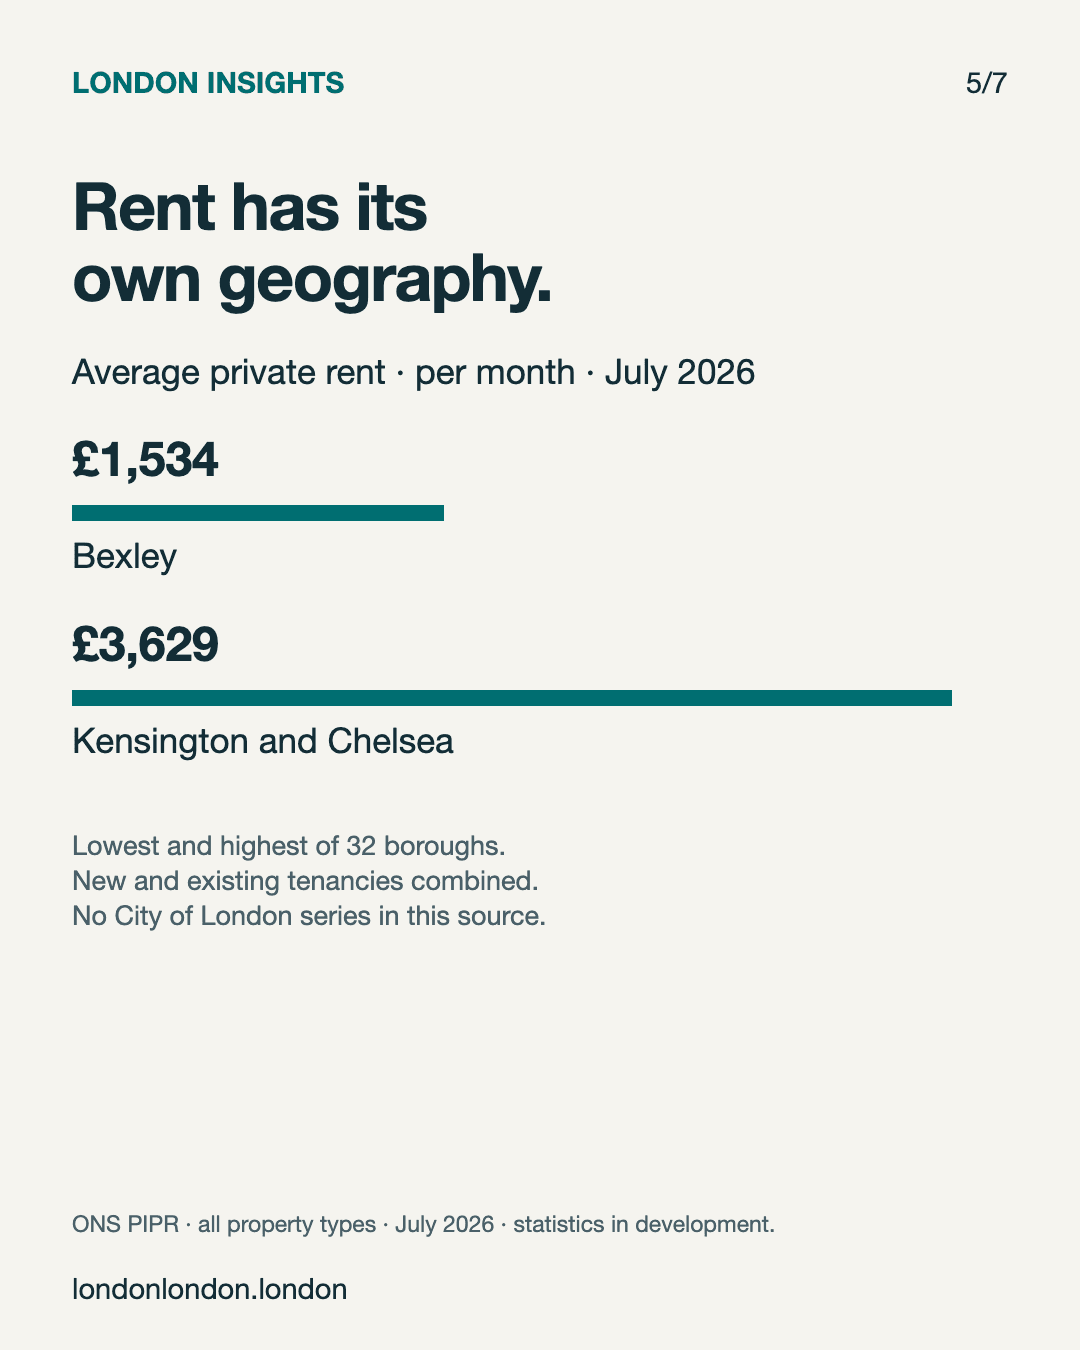
July 2026 monthly private rents range from £1,534 in Bexley to £3,629 in Kensington and Chelsea across 32 boroughs. Includes new and existing tenancies; City of London unavailable.
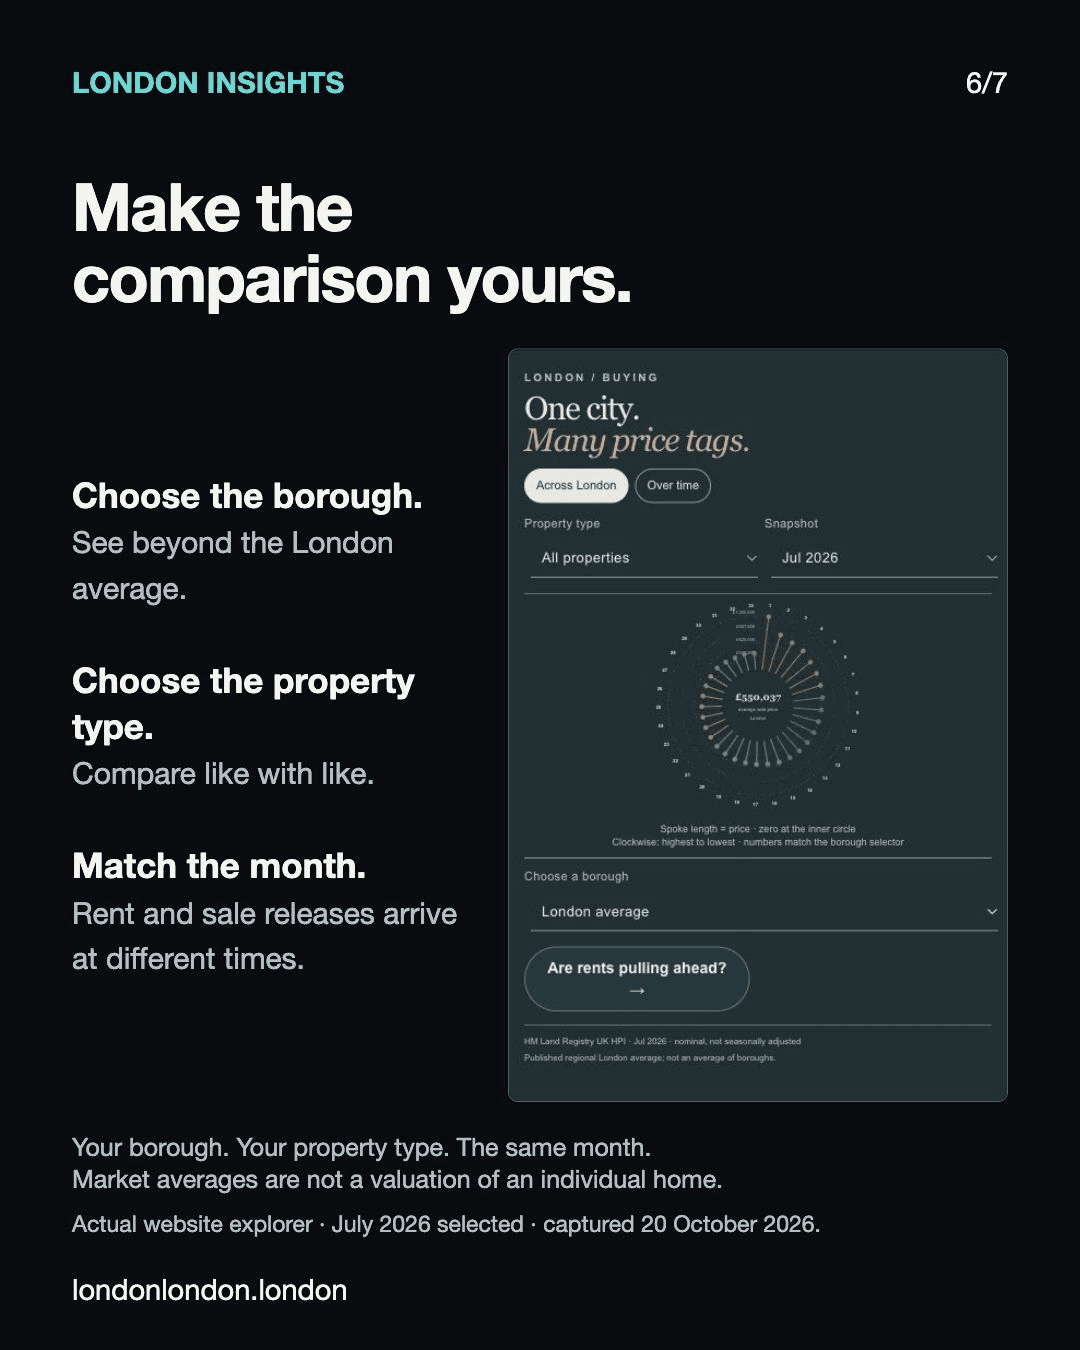
Three tips beside an actual crop of the LondonLondonLondon house-prices explorer: choose your borough, choose the property type, and match the month. The screenshot shows All properties, July 2026 and the borough selector.
Compare your own borough. Find house prices and rents on LondonLondonLondon. Visit londonlondon.london. London looks different from every postcode.
1 / 7

Swipe or scroll through the seven slides.

Rents up. Sale prices down.

London’s private rents rose 3.0% over the year to July 2026, while house sale prices fell 3.3%. These are annual index changes across all property types—not the return on buying a home.

The trend picture follows annual percentage changes from July 2023 to July 2026. Matching the month lets us compare their direction, while keeping the two measures distinct.

London is not one price.

July’s average sale price ranged from £375,604 in Barking and Dagenham to £1,232,640 in Kensington and Chelsea, the lowest and highest published averages across the 32 boroughs and the City of London.

These are mix-adjusted estimates, not asking prices or a valuation of an individual home.

Rent has its own geography.

Average monthly private rent ranged from £1,534 in Bexley to £3,629 in Kensington and Chelsea across the 32 boroughs. Rents include new and existing tenancies; the source has no City of London series.

Make the comparison yours.

Choose a borough, choose the property type and match the month. Sale and rental releases arrive at different times, so comparing the same period matters.

This story uses the website’s published releases retrieved on 19 October 2026. July was their latest shared month; the rental release also contained August. Figures are not seasonally adjusted. Recent UK House Price Index estimates are provisional; the Price Index of Private Rents is official statistics in development.

House-price sources & methodsRental sources & methods

ONS / HM Land Registry. Contains public sector information licensed under the Open Government Licence v3.0. © Crown copyright.

← All London Insights

Help us improve LondonLondonLondon

May we use Google Analytics cookies to understand visits and popular pages? Your choice won’t affect the site. Details and settings