
One city. Two measures.
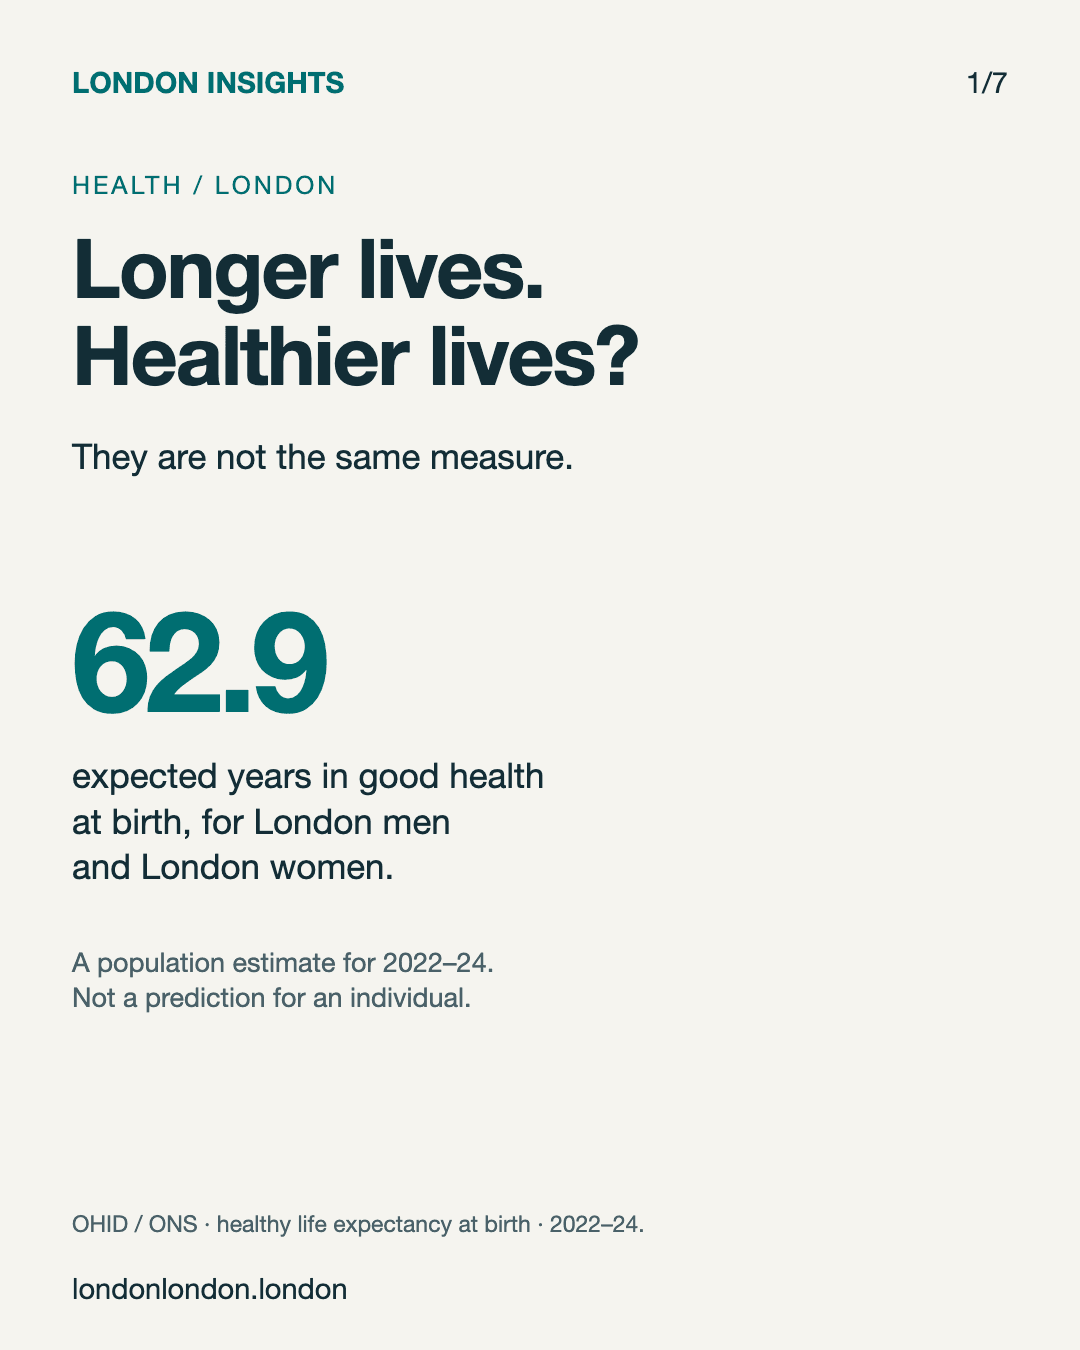
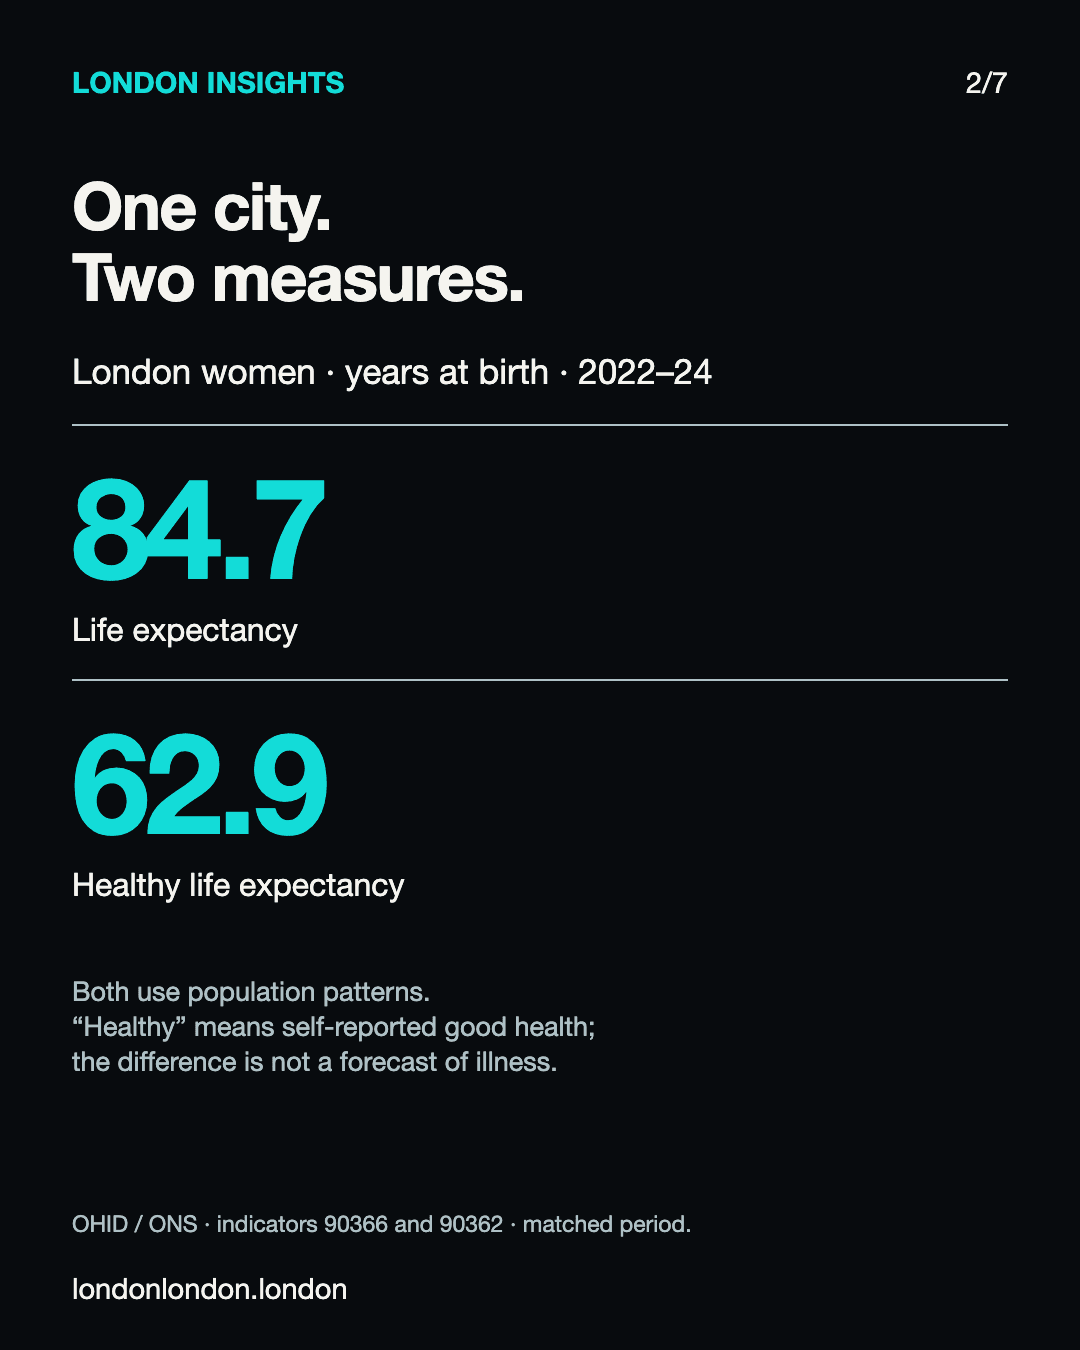
London’s healthy life expectancy at birth was 62.9 years for both men and women in 2022–24. It estimates years lived in good health by combining mortality patterns with self-reported general health.
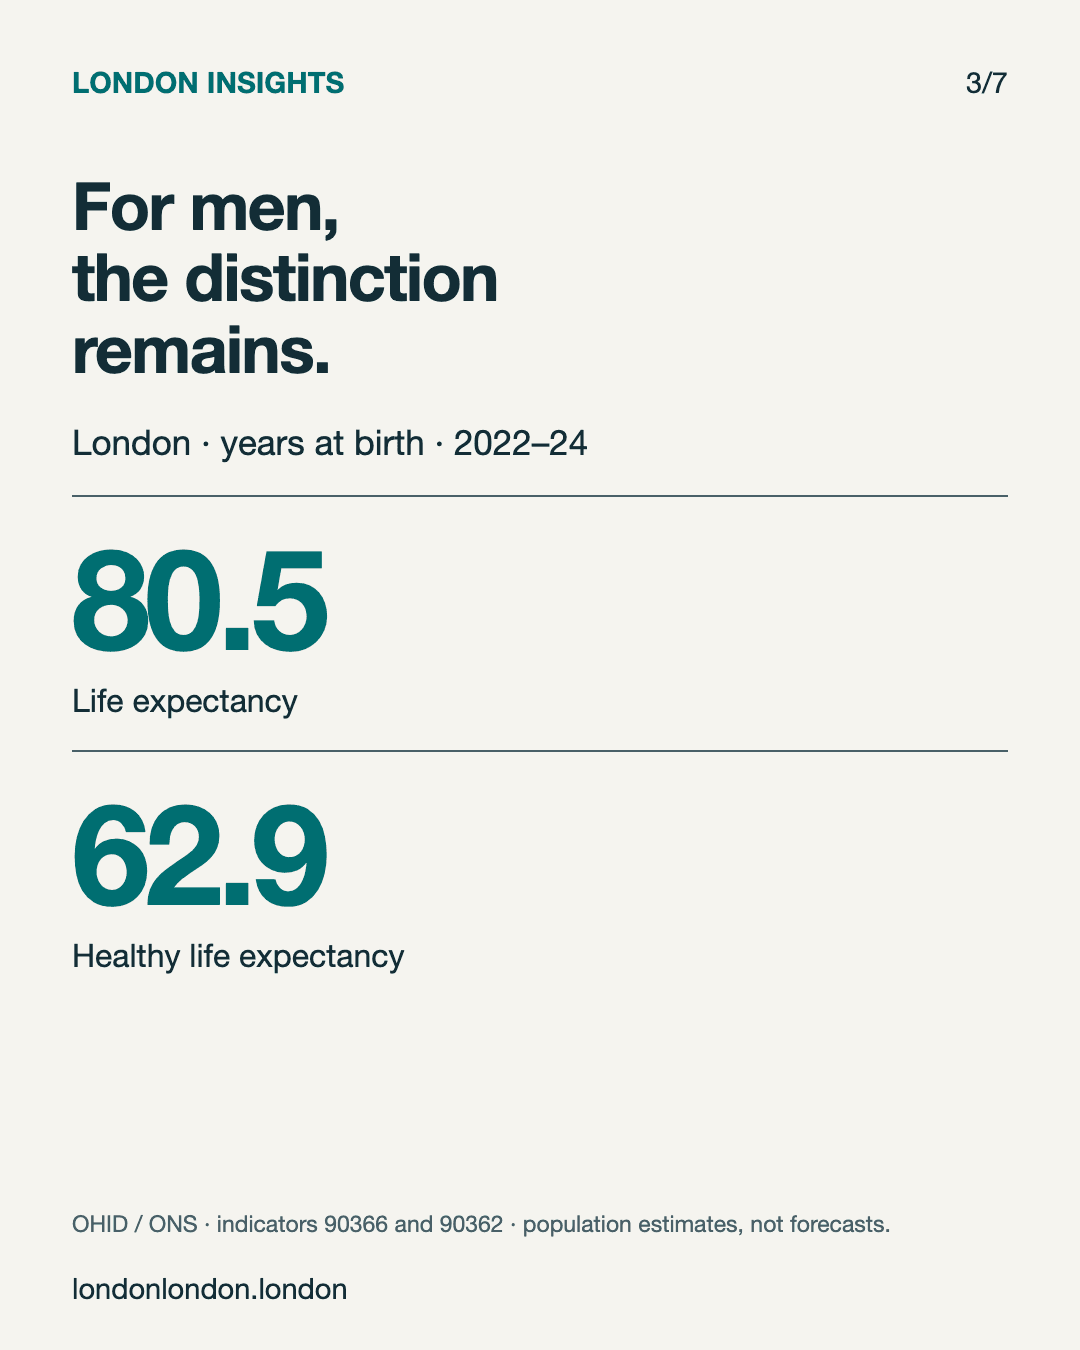
For women, life expectancy at birth was 84.7 years in the same period. For men, it was 80.5 years. These are population estimates, not predictions of an individual lifespan or a timetable of illness.
Men, by borough: an 11-year span.
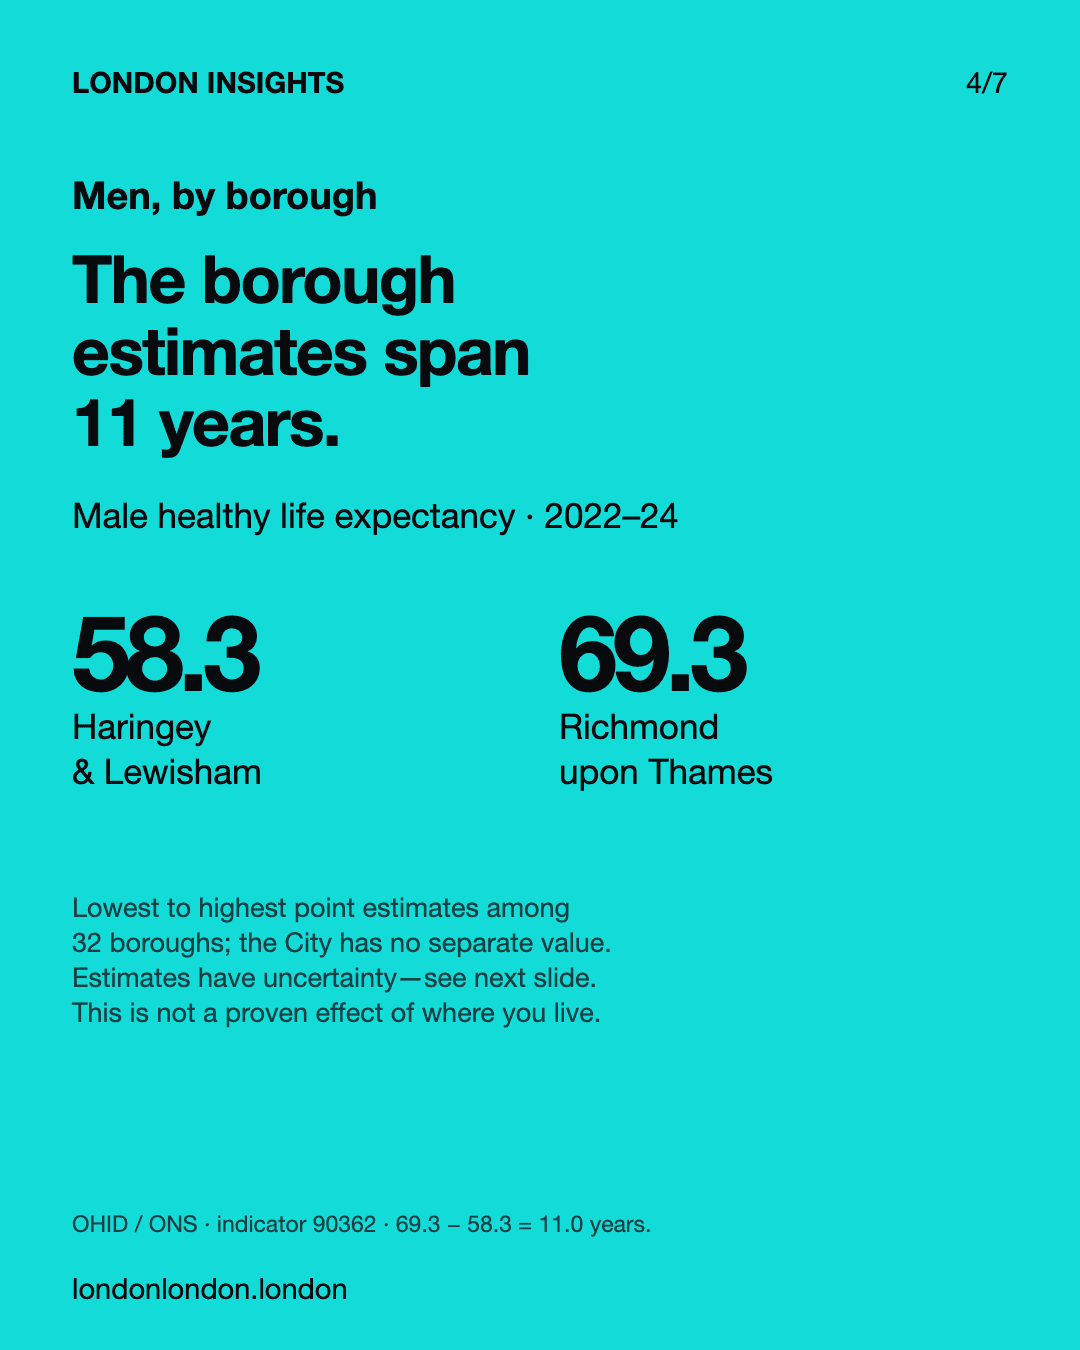
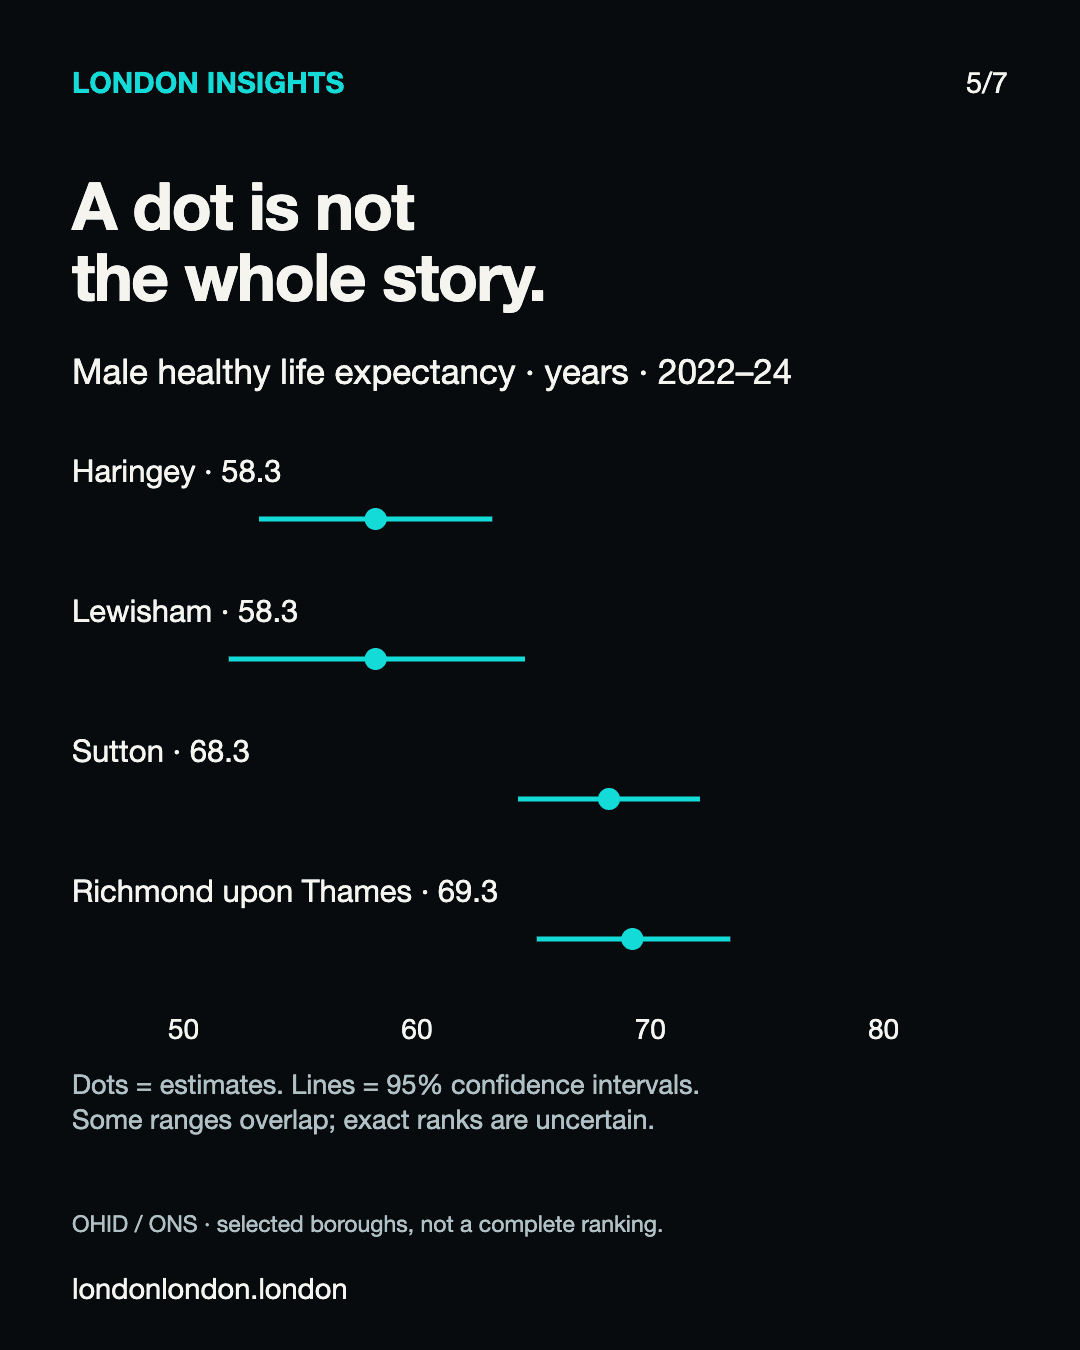
Male healthy life expectancy point estimates ranged from 58.3 years in Haringey and Lewisham to 69.3 years in Richmond upon Thames in 2022–24. That is an 11-year span among the 32 boroughs with separate published figures; the City of London has no separate value in this comparison.
The span describes the published point estimates. It does not establish that living in one borough causes a longer or healthier life.
A dot is not the whole story.
The lines around the dots show 95% confidence intervals: an indication of uncertainty around each estimate. For the four selected boroughs in the graphic, the intervals are 53.3–63.3 years for Haringey, 52.0–64.7 for Lewisham, 64.4–72.2 for Sutton and 65.2–73.5 for Richmond upon Thames.
Some intervals overlap. Small differences between point estimates should not be treated as a definitive ranking; these four examples are not a complete league table.
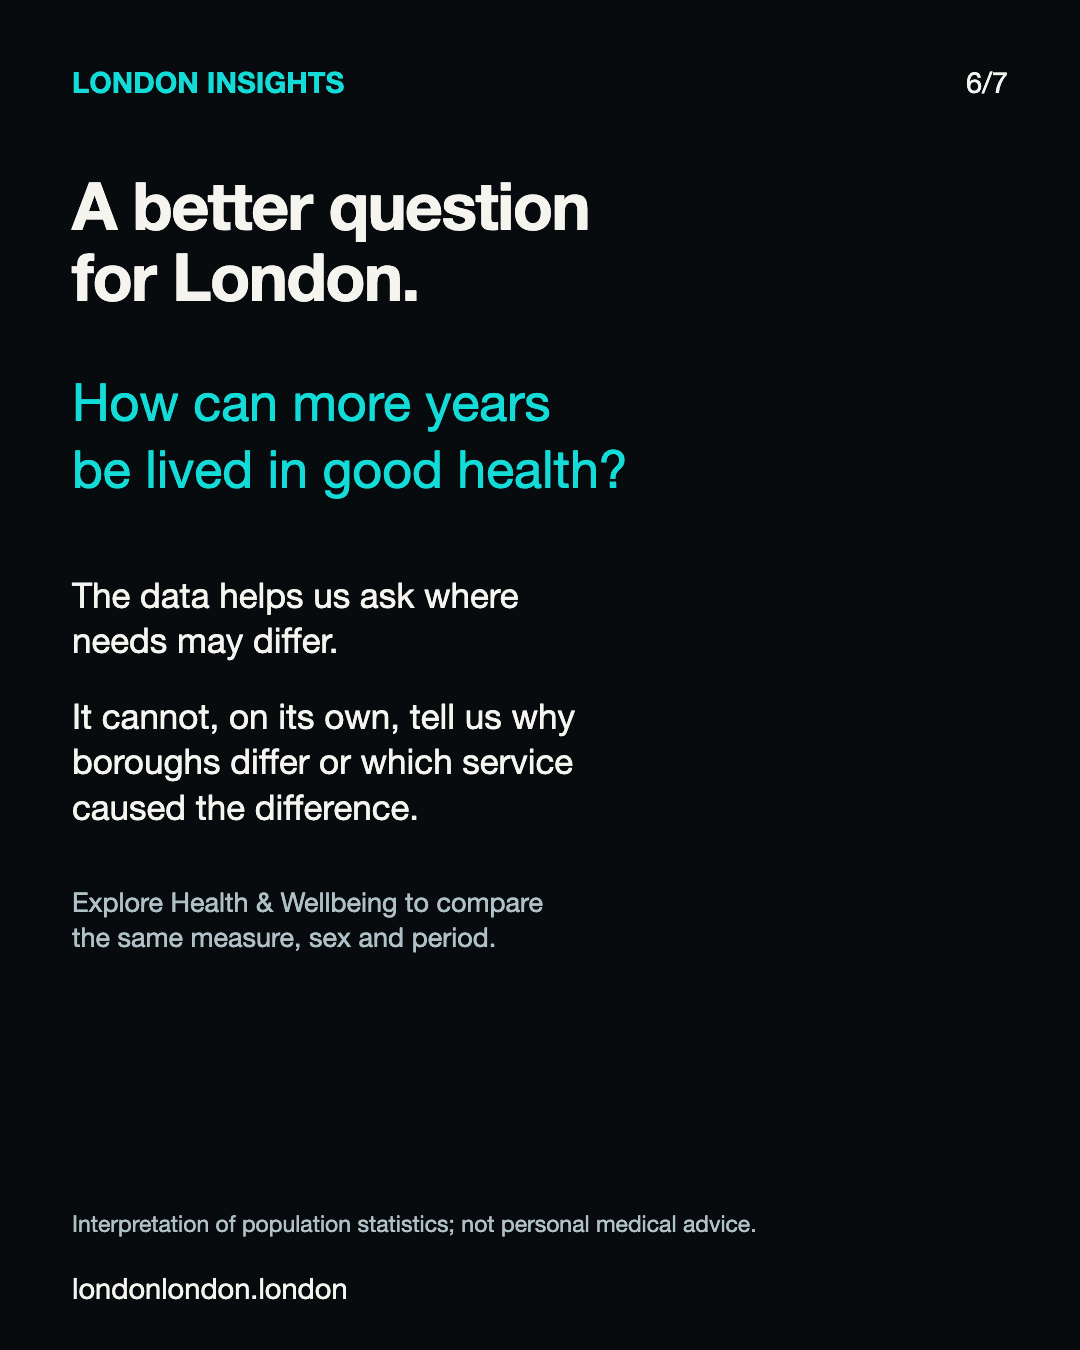
How can more years be lived in good health?
The figures help us ask where needs may differ. They cannot, on their own, explain why boroughs differ or which service caused a difference. Explore the same measure, sex and period to make a useful comparison.
Explore Health & Wellbeing →